How Many Accidents Occur at Stop Sign Intersections?

stop sign and car crash

National statistics reveal that one-third of all intersection crashes in the United States occur at stop sign controlled intersections – approximately 700,000 crashes annually. And more than 40% of fatal crashes that take place each year happen at stop sign intersections.

  • Common reasons why people run stop signs include: 
  • Inattention 
  • Impatience 
  • Failure to come to a complete stop, referred to as a rolling stop
  • Obstructed view
  • Distracted driving
  • Speeding
  • Reckless driving
  • Driving under the influence.


Drones for Traffic Management

NASA & AT&T Developing Drones for Traffic Management

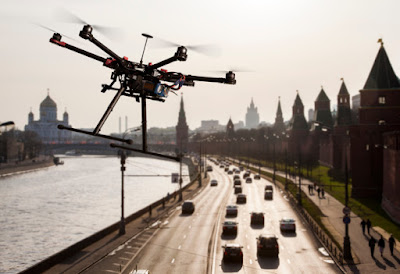
U.S. wireless operator AT&T announced it is teaming up with the National Aeronautics and Space Administration (NASA) to develop a traffic management system for drones. In a press release, AT&T said the goal of the collaboration is the creation of an Unmanned Aircraft System Traffic Management (UTM) solution that will support the safe and secure operation of drones in national airspace. “Working with NASA and others, we are designing the management system for a new frontier in aviation,” AT&T’s Vice President of Global Public Sector Solutions Mike Leff said. “Drones are already used in agriculture, public safety, construction, utilities, real estate, and TV. This research can help support the commercial and private use of drones nationwide.” AT&T said its roll in the project is to bring to the table expertise on networking, the Internet of Things (IoT), the cloud, identity management, and cybersecurity. The carrier said cybersecurity is a particular concern surrounding drones because easy access to the vehicles and their many potential uses could increase the risk of cyberattacks.  Read More

Are these cameras alternatives to the license plate reader cameras currently used on traffic lights?

Most Dangerous Intersections in California

Most dangerous intersections in Southern California

A new study shows the most dangerous intersections in California that have 10 or more accidents, injuries, or fatalities.  based on motor vehicle collision data from 2015. There were 444 total intersections ranked from the 435,000 compiled collision records, according to the data by Statewide Integrated Traffic Records System (SWITRS).

In total, there were 7,294 crashes, 7,478 injuries, and 57 fatalities. The average number of accidents per dangerous intersection was 16.43 and for injuries, it was 16.84. The City of Sacramento had the second-highest total number of dangerous intersections (13) trailing only Los Angeles (221), which is a noticeable difference.  Estey & Bomberger created the map and correlated the data.

We took the intersections and added them to our map of over 9,000 locations Nationwide.  Do a search for "California" and you will find these ranked locations.