Showing posts with label Traffic. Show all posts

Is A City Liable For An Accident In A Dangerous Intersection?

fender bender stop sign

Traffic accidents at dangerous intersections are unfortunately common, often leading to severe injuries or even fatalities. But when an accident occurs, an important question arises: can the city be held liable for negligence in maintaining a safe roadway?

In this article, we’ll explore the legal factors determining a city's liability for accidents at hazardous intersections and what steps you can take if you’ve been involved in such an incident.

When Can a City Be Held Liable?

Cities are responsible for maintaining roads, traffic signals, signage, and overall infrastructure to ensure public safety. However, proving a city's liability for an accident at a dangerous intersection is often complex and depends on the following factors:

1. Negligent Design or Maintenance

  • Faulty Road Design: If the intersection’s design inherently increases the risk of accidents, the city could be held accountable.
  • Poor Maintenance: Malfunctioning traffic lights, faded road markings, or obstructed signs can lead to accidents and liability claims.

2. Failure to Address Known Hazards

  • Prior Complaints: If residents or drivers have reported issues, but the city failed to act, it may strengthen the case for liability.
  • Accident History: A high frequency of accidents at the same location can indicate a known problem that the city neglected to fix.

3. Violation of Traffic Safety Standards

  • Non-Compliance: Intersections that fail to meet federal or state traffic safety guidelines could implicate the city in negligence.
  • Temporary Hazards: Construction zones without adequate signage or barriers can also lead to municipal liability.

Challenges in Proving a City’s Liability

Filing a claim against a city for an intersection-related accident involves several hurdles:

1. Government Immunity

Cities often have legal protections under “sovereign immunity,” which limits their liability in certain cases. Exceptions exist, but these vary by state and municipality.

2. Statute of Limitations

The timeframe for filing a claim against a government entity is typically shorter than for standard personal injury lawsuits. Failing to act promptly can result in losing your right to compensation.

3. Burden of Proof

You must prove the city's negligence directly contributed to the accident. This often requires evidence such as:

  • Accident reports
  • Photographs of the intersection
  • Witness testimony
  • Expert opinions on road design or traffic engineering

Steps to Take After an Accident at a Dangerous Intersection

If you suspect a city’s negligence played a role in your accident, follow these steps:

  1. Document the Scene: Take photos of the intersection, road conditions, and any contributing factors like missing signage.
  2. File a Police Report: Ensure the incident is officially documented.
  3. Consult an Attorney: Legal experts can assess the viability of your claim and guide you through filing against a municipality.
  4. Submit a Government Claim: In many cases, you must file a formal notice with the city or county before pursuing a lawsuit.

What cities have been sued for dangerous intersections?

Numerous cities have faced lawsuits related to dangerous intersections over the years. While it's not possible to provide an exhaustive list, here are a few notable examples:

Los Angeles, California, USA: The city of Los Angeles has faced multiple lawsuits over the years due to accidents in dangerous intersections. These cases often involve allegations of inadequate signage, faulty traffic signal timings, or insufficient safety measures.

New York City, New York, USA: With its complex road network and high traffic volumes, New York City has also been sued for accidents in dangerous intersections. Claims typically involve issues such as poor road design, inadequate pedestrian crosswalks, or malfunctioning traffic signals.

Chicago, Illinois, USA: Chicago has had its share of lawsuits regarding dangerous intersections. Accidents resulting from factors like obscured signage, confusing road layouts, or lack of visibility have been subject to legal action against the city.

Melbourne, Victoria, Australia: In Melbourne, there have been instances where the city has been sued for accidents in hazardous intersections. Some cases have involved claims of inadequate traffic control measures or failure to address known safety concerns.

London, United Kingdom: London has faced legal action related to dangerous intersections as well. Issues such as inadequate pedestrian crossings, unclear road markings, or insufficient traffic management have been raised in lawsuits against the city.

These are just a few examples, and it's important to note that cities around the world have faced legal challenges related to dangerous intersections. The outcome of each case depends on the specific circumstances, local laws, and the evidence presented in court. It's always advisable to consult with a legal professional for accurate and up-to-date information on specific cases or to discuss your situation.

Conclusion

Cities have a duty to maintain safe intersections, but proving their liability for an accident can be legally intricate. If you’ve been involved in an accident at a dangerous intersection, understanding your rights and acting swiftly can make all the difference.

For personalized guidance, consult with an experienced traffic accident attorney to evaluate your case and explore your options.

Top 15 Worst U.S. Cities for Traffic

Every year, U.S. drivers waste countless hours sitting in traffic congestion. In 2023, the average American driver lost 42 hours to traffic jams, roughly equivalent to an entire workweek, according to the 2023 INRIX Global Traffic Scorecard.

The chart below highlights the 15 U.S. cities with the worst traffic congestion in 2023, based on data from INRIX. The figures represent the average number of hours each driver lost to traffic during peak commute hours compared to off-peak hours.

Which U.S. Cities Have the Worst Traffic?

Traffic Lights Out at Over 1,000 Houston Intersections After Beryl: What You Need to Know

In the aftermath of Tropical Storm Beryl, Houston is grappling with widespread power outages affecting over 1,000 intersections. This sudden disruption has left many intersections without functioning traffic lights, causing significant traffic congestion and raising safety concerns for motorists and pedestrians alike.

10 Reasons You're Sitting in Traffic

Are you tired of spending what feels like half your life stuck in traffic? It's frustrating, time-consuming, and can leave you feeling drained before you even reach your destination. While traffic jams are often seen as an unavoidable part of urban life, understanding the reasons behind them can help you navigate your way around or even avoid them altogether. Here are 10 common reasons why you might find yourself sitting in traffic:

The World's Most Dangerous Roads: Journey Through Perilous Routes

Traveling can be an exhilarating experience, but for those who traverse the world's most dangerous roads, it's a heart-pounding adventure fraught with risks and challenges. From steep mountain passes to narrow cliff-side paths, let's dive into some of the globe's most treacherous roadways that test the nerves of even the most seasoned drivers.

New Software Uses AI to Identify the Most Hazardous City Intersections


City traffic intersections can be challenging and dangerous for drivers, pedestrians, and cyclists alike. Identifying high-risk intersections is crucial for improving road safety and reducing accidents. In a groundbreaking development, new software leveraging artificial intelligence (AI) is revolutionizing the way cities pinpoint their most hazardous intersections. By analyzing vast amounts of traffic data, this cutting-edge technology is helping authorities take proactive measures to enhance road safety and save lives.

What is the Best Time of Day to Travel in LA?

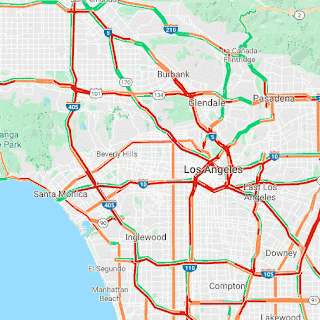
la traffic map all red

While Los Angeles traffic can be congested at almost any time of the day, there are some times when it is generally considered safer and less busy to drive.

5G Technology to Help Monitor Dangerous Intersections


What is a smart intersection and how does 5G help? 

The system of sensors, video-based detection, connected traffic signals, and remote monitoring capabilities, provided by traffic systems technology company Miovision, has been deployed across five intersections along a busy corridor in the heart of Detroit. Smart traffic technology from Miovision has already been deployed in over 40 percent of the intersections in Detroit and now San Diego is looking to do the same.

Continental and Panasonic are a few other companies in the smart intersections game.

Using the new AI technology, the intersections are able to sense and understand what’s happening on the roadways in real-time and trigger responses, such as:
  1. Traffic lights that can lengthen green lights to accommodate cyclists who wouldn’t otherwise be able to make it through the intersection 
  2. Alerts that warn drivers of connected cars or Waze (connected app) users that jaywalkers are ahead 
  3. Traffic lights that provide priority access to emergency and police vehicles 
  4. Intersections that understand and analyze the near misses between users such as pedestrians in the crosswalk, cyclists, and drivers 
  5. Traffic lights allow for freight vehicles to have green light priority, encouraging freight use on certain intersections away from pedestrian-heavy corridors.
  6. A faster network will also allow for autonomous driving in San Diego. Smart cars will rely on sensors around the city to pick up on someone running across the street or another car turning the corner.
Read more on the San Diego smart intersections project but unsure if this is being provided by Qualcomm.   


Uber Launches Historic Traffic Map

Uber Launches Historic Traffic Map

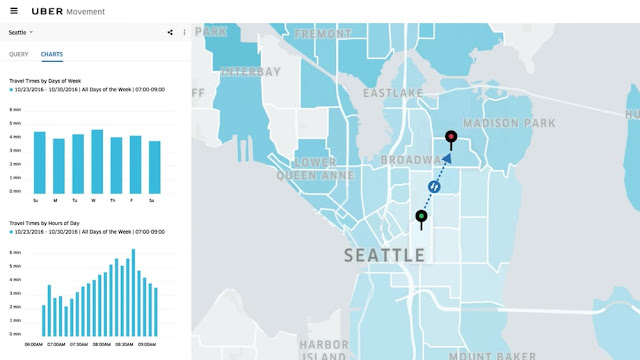
Uber is opening up in an area where it might make sense competitively for it to stay more closed off: The ride-hailing company’s new Movement website will offer up access to its data around traffic flow in scores where it operates, intended for use by city planners and researchers looking into ways to improve urban mobility. The basic idea is that Uber has a lot of insight into how traffic works within a city, and it can anonymize this data so that it isn’t tied to specific individuals in most cases. So where that’s possible, Uber is going to begin sharing said data, first to specific organizations who apply for early access, and then eventually to the general public. Uber says it was looking at all the data it gathered and began to realize that it could be used for public benefit, and assembled a product team to make this happen. The result of this effort was Movement, which aims to address problems city officials and urban planners encounter when they’re forced to make key, transformational infrastructure decisions without access to all of, or the proper information about actual conditions and causes. Essentially, according to Uber, it’s hoping to make it easier for those with influence over a city’s transportation picture to make the right decision, and to be able to explain why, where and when the changes are happening with accurate data backing them up. It also wants to do this in a way that makes it easy for organizations to work with, so it’s releasing the data organized around traffic analysis zones within cities, which are agreed-upon geographic demarcations that help with existing urban planning and traffic management.

Uber releasing this kind of data publicly is going to raise some eyebrows from privacy advocates, but the company stresses that it’s ensuring user privacy by only offering up data where it can be successfully aggregated and anonymized. For parts of a city where it determines there isn’t enough data to properly protect driver and passenger identities, it simply won’t return results for queries, Uber says. Another question is why Uber would bother at all, given that its ability to accurately map traffic demand is part of the reason its able to do demand prediction well at all, which is a core competitive advantage for it in the ride-sharing business. Uber says it wants to do some good in the cities where it operates, for one, but it also stands to benefit from infrastructure improvements in cities.  Maybe Uber would be open to taking Bad Intersections data as well? 


Drones for Traffic Management

NASA & AT&T Developing Drones for Traffic Management

U.S. wireless operator AT&T announced it is teaming up with the National Aeronautics and Space Administration (NASA) to develop a traffic management system for drones. In a press release, AT&T said the goal of the collaboration is the creation of an Unmanned Aircraft System Traffic Management (UTM) solution that will support the safe and secure operation of drones in national airspace. “Working with NASA and others, we are designing the management system for a new frontier in aviation,” AT&T’s Vice President of Global Public Sector Solutions Mike Leff said. “Drones are already used in agriculture, public safety, construction, utilities, real estate, and TV. This research can help support the commercial and private use of drones nationwide.” AT&T said its roll in the project is to bring to the table expertise on networking, the Internet of Things (IoT), the cloud, identity management, and cybersecurity. The carrier said cybersecurity is a particular concern surrounding drones because easy access to the vehicles and their many potential uses could increase the risk of cyberattacks.  Read More

Are these cameras alternatives to the license plate reader cameras currently used on traffic lights?

Most Dangerous Intersections in California

Most dangerous intersections in Southern California

A new study shows the most dangerous intersections in California that have 10 or more accidents, injuries, or fatalities.  based on motor vehicle collision data from 2015. There were 444 total intersections ranked from the 435,000 compiled collision records, according to the data by Statewide Integrated Traffic Records System (SWITRS).

In total, there were 7,294 crashes, 7,478 injuries, and 57 fatalities. The average number of accidents per dangerous intersection was 16.43 and for injuries, it was 16.84. The City of Sacramento had the second-highest total number of dangerous intersections (13) trailing only Los Angeles (221), which is a noticeable difference.  Estey & Bomberger created the map and correlated the data.

We took the intersections and added them to our map of over 9,000 locations Nationwide.  Do a search for "California" and you will find these ranked locations.

Did Edison Workers Cause The Deadly 10 Freeway Bus Accident?

10 freeway bus crash wreckage

Of course the "Drive By Media" does not report that So Cal Edison & CHP might be partly to blame for the deadly bus accident.  It was dark when the crash happened at 5:15 am. The semi was going only about 5 mph in the second-from-right westbound lane; traffic had slowed because of a traffic break a mile or two ahead to allow Southern California Edison workers to pull wires across the 10 freeway.
"An Edison maintenance crew had slowed down traffic on Interstate 10 before the vehicles crashed just north of the desert resort town of Palm Springs, California Highway Patrol Border Division Chief Jim Abele said. The work had gone on for hours without problems, he said. CHP officers had been slowing traffic to allow Southern California Edison workers to string wires across the freeway, Abele said."
map of 10 freeway bus crash location
10 Freeway Accident Location After Curves
map of 10 freeway bus crash location
10 Freeway Deadly Bus Accident Location
As you can see the accident occurred near a curve on the 10 freeway.  Cars and trucks are often moving at 75-90+ MPH on this section of freeway.

Did the California Highway Patrol give proper warning to drivers westbound?

Did So Cal Edison properly warn drivers that they were stopping traffic miles ahead?

Were there warning signs placed on the freeway miles back to warn of the potential slow down?

I am curious if Waze was warning drivers at the time of the slow down on their app at 5am?

Seems to me that this could have been prevented and not a lot is being reported on the topic.


This is Why LAX Traffic is Such a Mess!

satellite image showing Southwest construction wall causing traffic problems
Southwest Terminal 1 Construction & Drop-Off Bottleneck

Look at the satellite image picture above.  When is the last time you saw no traffic during the day when dropping off at LAX?   LAX drop-off traffic is a complete mess and has been ever since Southwest Airlines embarked on their new terminal 1 construction.  It now takes passengers up to 30 minutes just to get into the airport once you are nearby.  On several occasions, it has taken me 20 to 30 minutes just to get from underneath the tunnel to the drop-off gate at terminal one.  It doesn't matter if it's noon in the middle of the workweek or 4:30 am.  The delays of getting into the terminal are ridiculous and caused by a poorly designed construction plan.

The wall you see in red is consolidating traffic from 6 lanes down to 4.  Traffic merging and Southwest drop-off are causing the bottleneck that backs up for almost a mile outside of the airport. I have been flying out of the Southwest terminal for two decades and traffic never used to be this bad even during the busiest rush hour periods.  Cars used to be able to flow in and out of terminal 1 drop-off freely without a bottleneck.

United & Southwest traffic view of red and green at LAX
LAX Southwest Terminal Traffic Congestion

No police officer or traffic manager is capable of managing or correcting the flow after the light.  It doesn't take a genius to see that cars are getting stuck trying to drop off passengers because they now are forced to drive a few hundred yards further.

What is this wall protecting and why does it have to stick out and cut off 2 lanes of drop-off traffic?  The wall looks to be useless has caused hundreds of thousands of passengers to miss their flights who don't arrive 2 before their flight.  Can they simply remove it or push it back until the end of the construction project?

You can thank these companies for the $500M 4 year construction plan & ridiculous mess that looks to be with us until 2018:  AvAirPros, ODEMCO, PGAL and Hensel Phelps Construction Company.

AvAirPros, ODEMCO, PGAL, Hensel Phelps Construction
LAX Terminal One Construction Managers
It is obvious that nobody from any of these companies above did any traffic studies on the impact of cutting off 2 lanes from 6 down to 4 that feed into the terminals.  I am also surprised to see very little news coverage on the topic.  The news seems to attribute the problem to the increased traffic volume of passengers but I know this is a completely false excuse.

Are any executives from LAX doing anything about the problem?

Have any other airlines thought about taking legal action against these companies or LAX for the miss-management?

Flying out of other regional airports is becoming a more viable option these days even though I live 10 minutes from the airport.  It now takes me just as long for me to get to John Wayne Airport (40 miles away) as it does to LAX (5 miles).

I would love to hear your comments below.  Please send this blog post to your friends, politicians, and LAX officials.  Let's get this problem solved quickly.

Listening to the Republican National Convention speech about Donald Trump fixing an ice rink years in a few months and millions of dollars cheaper than the Government inspired me to write this lengthy blog post.  My gut tells me this is just incompetence and not an oversight because nothing is being done to fix the obvious problem.  I think LAX is a prime example of bureaucracy getting into the way of fixing things quickly and efficiently.   Hopefully, this blog post will be read by the people in charge and take action.  

Last Minute Flight Deals!

3D Crosswalk Street Paintings

mother and daughter walking across the street on 3D crosswalk
Do 3D crosswalks slow traffic down?

A mother-daughter artist duo has designed a simple but potentially effective solution to a major road safety problem.

Waze warns you about dangerous intersections in 5 big US cities

traffic jam in NYC showing gridlock
Waze Dangerous Intersection
Most navigation apps can get you from A to B while avoiding traffic snarls, but they rarely give you a feel for how risky the drive might be. Is that intersection a cakewalk, or a death trap?

Waze thinks it can help. It's now alerting drivers in five big US cities (Boston, Los Angeles, New York, San Francisco and Washington) when they approach intersections with the historically high crash and injury rates -- get close to one of these danger zones and you'll get a reminder to drive carefully. This won't do anything to stop other drivers from ruining your day, but it should prepare you for the dangers ahead.  Read more

This comment below is particularly interesting to me . . .


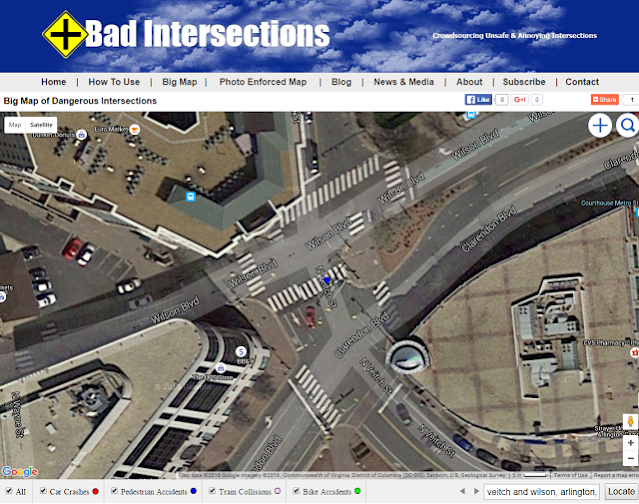
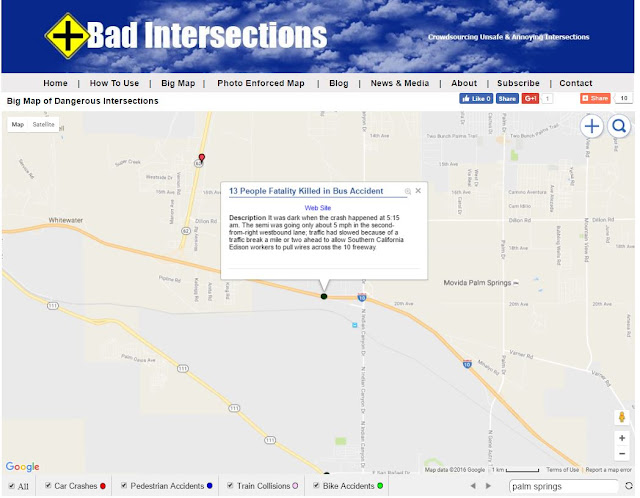
United States Dangerous Intersections Map


Bad Intersections is a crowdsourced map database of intersections that are unsafe and annoying. Our mission is to identify hazardous intersections for pedestrians, cyclists, and drivers. Our goal is to identify intersections with the following characteristics: lots of accidents (vehicles, bikes, pedestrians), confusing driver navigation, long lights, congestion, traffic jams. driving.  Search our map at BadIntersections.com