Showing posts with label Map. Show all posts

How To Subscribe To The BadIntersections.com Database

Are you tired of navigating through dangerous intersections without knowing their history? Subscribe to the Bad Intersections database today and gain access to crucial information that could save lives. For just $1 per month or a mere 3 cents per day, you'll have peace of mind knowing you're equipped with the most comprehensive intersection safety data available.

How to Subscribe to BadIntersections.com

Subscribing to BadIntersections.com is quick and easy:

  1. Visit BadIntersections.com.
  2. Sign in with your Google account to start accessing the Traffic Safety Database immediately.
  3. Subscribe and begin your journey towards a safer commute today.

How Much Does A Monthly Subscription Cost?

  • .03 Cents Per Day
  • $1 Per Month For Access to the Map Database 
  • Try it out for 7 days risk-free. Cancel at any time using your Google Subscriptions Account

💥 All-Access Map Bundle: 22 Maps for $9.95/month (FREE 7-DAY TRIAL)

Syndicated Maps bundled subscriptions

Syndicated Maps has recently launched a value-packed bundled subscription that gives users access to all 22 of its niche maps for just $9.95 per month—a savings of over 50% compared to subscribing individually. This all-access plan was created in response to user demand for a more affordable way to explore multiple data layers across traffic enforcement, environmental hazards, wireless coverage, energy infrastructure, and public safety. Whether you're a researcher, commuter, traveler, or concerned homeowner, this bundle lets you seamlessly tap into detailed, location-based intelligence from across the entire network.

Each map serves a specific purpose—from helping drivers avoid speed traps to alerting families about nearby environmental hazards. The Syndicated Maps network has earned the trust of millions of users annually, including commuters, journalists, health professionals, and urban planners. 

🚗 Driving, Danger & Traffic Awareness

Why Choose Bad Intersections?

  • Comprehensive Intersection Analysis: Access detailed maps and analytics pinpointing high-risk intersections, including accident data, traffic patterns, and safety ratings.

  • Real-Time Updates: Stay informed with real-time updates on intersection safety status and incidents in your area.

  • Intuitive Interface: Navigate our user-friendly web-based map interface effortlessly, designed for easy access and clarity on any device, without the need for additional downloads.

  • Community-Driven: Join a community committed to safer driving, contributing updates and insights to keep the database current and relevant.

Subscription Benefits

  • Unlimited Access: Enjoy unrestricted access to our comprehensive database from any device, ensuring you're always prepared and informed.

  • Regular Updates: Benefit from continuous updates and new features aimed at enhancing your driving safety and experience.

  • Affordable Plans: Choose from affordable subscription plans tailored to meet the needs of individual drivers, families, and businesses.

Join BadIntersections.com now and drive confidently, knowing you have the information you need to navigate your world safely.

What Happens if You Crash with a Waymo Driverless Car

The Rise of Driverless Cars and Waymo

Waze Dangerous Intersections Alerts Database

Waze dangerous intersections
Waze Dangerous Intersections Alerts

Navigating busy roads can be challenging, especially in areas with high accident rates. Waze, a community-driven GPS navigation app, has revolutionized road safety with its Dangerous Intersections Alerts Database, a feature designed to notify drivers about hazardous intersections. This article explores the benefits of the database, how it works, and how you can use it to improve your driving experience.

What is the Waze Dangerous Intersections Alerts Database?

The Dangerous Intersections Alerts Database is a feature within Waze that identifies intersections prone to accidents based on user reports and traffic data. When approaching a flagged intersection, drivers receive a notification prompting them to exercise caution. These alerts aim to reduce accidents by increasing driver awareness in high-risk areas.

How the Database Works

The alerts are powered by data sourced from:

  • User Reports: Waze users can report accidents, near misses, and unsafe conditions at specific intersections.
  • Traffic Patterns: The app analyzes real-time traffic flow to identify intersections where sudden braking or frequent stops occur.
  • Historical Data: Waze leverages government and third-party traffic data to supplement user-generated insights.

This dynamic combination of data ensures that the alerts are accurate and regularly updated.

Benefits of Using the Waze Dangerous Intersections Alerts

  1. Increased Awareness: Alerts prompt drivers to slow down and pay closer attention when approaching risky intersections.
  2. Accident Prevention: By reducing surprises, these notifications help prevent rear-end collisions and other common intersection-related accidents.
  3. Community-Sourced Insights: The Waze community continuously improves the database by contributing firsthand experiences.
  4. Enhanced Route Planning: Knowing about dangerous intersections in advance can help you plan safer routes.

How to Use Waze Dangerous Intersections Alerts

Follow these steps to make the most of this feature:

  1. Download and Set Up Waze: Ensure the app is installed on your smartphone and grant it location access.
  2. Enable Alerts: Go to the app settings and turn on "Hazard Alerts" under the Safety & Navigation section.
  3. Contribute Data: Report dangerous intersections in your area to help others stay safe.
  4. Stay Updated: Keep your app updated to access the latest database improvements and features.

Popular Use Cases

  • Urban Areas: Cities with complex road systems and heavy traffic often have a high number of dangerous intersections.

Understanding the Pitfalls of Phone Navigation Dependency

Why You Should Diversify Your Navigation Skills

How Do Self-Driving Cars Use Sensors and Mapping To Prevent Accidents

Self-driving cars use advanced sensors and automated mapping technologies to prevent accidents by constantly monitoring their surroundings, making real-time decisions, and responding to potential hazards. These technologies work together to create a comprehensive picture of the car's environment and enable the vehicle to navigate safely and avoid collisions. Here's how they work:

How To Add Dangerous Intersections Shortcut To Phone

Bad Intersections Mobile Web App Map 

The mobile app of dangerous intersections near you.  A location-based app that shows you hazardous locations nearby.  Progressive web apps are the wave of the future and don't require native app downloads. 

How you add our web app to your iPhone home screen:

Pedestrian Fatalities National Map

In recent years, pedestrian fatalities have been a significant concern in traffic safety. In 2019, for example, there were 6,205 pedestrian fatalities reported in the United States. This represented a 46% increase from the number of pedestrian fatalities reported in 2010. It's worth noting that the number of pedestrian fatalities can fluctuate year to year due to various factors, including changes in population, road conditions, traffic patterns, and safety initiatives.

The number of pedestrian fatalities reported each year in the United States has varied. However, it is important to note that these figures are subject to change and should be verified with the latest data from reliable sources such as the National Highway Traffic Safety Administration (NHTSA) or other relevant authorities.

Some common factors that have been identified as contributing to pedestrian fatalities include:

Vehicle Speed: Higher vehicle speeds increase the likelihood and severity of pedestrian fatalities. Collisions at higher speeds leave pedestrians with less time to react and reduce the chances of avoiding or surviving an impact.

Impaired Driving: Alcohol or drug impairment significantly impairs a driver's ability to react and make sound judgments, increasing the risk of pedestrian accidents and fatalities.

Distractions: Distracted driving, such as texting, talking on the phone, or interacting with in-vehicle technology, diverts a driver's attention from the road and pedestrians, increasing the risk of accidents.

Intersection-related incidents: Pedestrians are particularly vulnerable at intersections, where vehicle-pedestrian conflicts are more likely to occur. Factors like red-light running, failure to yield right-of-way, or improper turning contribute to pedestrian fatalities.

Poor Visibility: Low-light conditions, lack of street lighting, or pedestrians wearing dark clothing can decrease visibility for both drivers and pedestrians, increasing the risk of accidents.

Age: Children and older adults are considered more vulnerable to pedestrian accidents due to factors such as limited mobility, unpredictable behavior, or reduced ability to assess traffic situations.

Buying a Home In A Safe Neighborhood

Dangerous Intersection Ahead

If you are buying a home these days you should probably do your due diligence on dangerous intersections that are within a few blocks of your home.  Especially if you have kids and these kids like to play outside and walk to school or around the neighborhood.  Common sense would tell you that your local government should provide a map of these hazardous intersections and provide this data to Google Maps and other navigation sources.  Does this happen?  Off course it doesn't!!!   

One of the biggest concerns of a prospective home buyer today is the safety of street and neighborhood.  What kind of traffic on the street next to the home and is it safe to walk the streets and have my kids play outside.  Most people don't often think of doing due diligence on historic accidents in the neighborhood or street.  We have even done a map showing dangerous schools near hazardous intersections.  

Most drivers are much more more distracted than they were 20 years ago and thus accidents and pedestrian fatalities have increase significantly.  Here is an article about the top reasons that cause a dangerous intersection and another article about the top 10 causes of death among people ages 15-29.  

It is not always transparent if you are new to a neighborhood if there have been historic problems with a particular intersection and its not easy to find news articles and get information.  In fact, not all cities keep historic accident records and are required to publish the information for fear of liability.  Public relations is a huge part of trying to squash any negative press about intersections that are "dangerous by design" because cities don't want the liability or lawsuit.  Cities don't have fix problems unless they are forced to fix the issue with enough pressure.  

Here is a person in Redondo Beach that won a lawsuit against the city for $27M because he proved the intersection was dangerous by design and the city did nothing to fix the problem.  

BadIntersections.com uses public news data sources and user contributions to map dangerous vehicle, pedestrian, bike and train intersections.  We collect thousands of new fatalities and articles from around the World highlighting dangerous intersections.  The map is free to search and can be found by clicking on the map below.   If you see an intersection area that you would like us to add please email us an article or click on the + directly on the map to contribute the location.  Keep in mind we do not accept all submissions unless the information is complete with substantiated evidence.  
  
Map of Hazardous Intersections & Fatalities

We often get emails from real estate agents looking for data to help their clients better understand what dangerous intersections exists in the neighborhood near the home.  This is often true of out of state buyers looking at homes who are unfamiliar with the area.   Home buyers from out of the area often want to get a feel for the area without having to see the location first hand and want to know if a particular home or apartment is near any hazards. 

Badintersectionscom is actively trying to dangerous intersection locations used by real estate companies like Zillow, RedFin & Realtor.com.  We think hazardous road location data should be an attribute used by real estate companies similar to how Walkscore provides a information about things nearby a home like schools, restaurants and parks.  

Most real estate companies have been very reluctant to share this data with prospective home buyers for obvious reasons.  Why would any real estate agent want to give a reason NOT to buy a home?  Hopefully, this culture of dishonesty will change in the near future and this data can provide some transparency.  

Los Angeles Threatens To Sue Waze


In the past, some cities have expressed frustration with Waze because it allows users to report shortcuts and alternative routes through residential streets, potentially diverting traffic away from main roads. This can lead to increased traffic in residential areas and concerns over public safety.

A Los Angeles councilman is asking the city to consider legal action against Waze over complaints that the navigation app is recklessly guiding motorists off thoroughfares and into residential neighborhoods in search of shorter or quicker routes.

Councilman David Ryu sent a letter Tuesday to the city attorney’s office, outlining what he says are dangerous conditions created by Waze users who are looking for “alternate routes to traditional arteries” in neighborhoods from Hancock Park and Los Feliz to the San Fernando Valley.

Ryu claims one narrow street in his Sherman Oaks district sometimes sees more than 650 vehicles an hour because of drivers using the Google-owned app. He says the increased traffic is causing accidents and damaging roads not meant for heavy traffic.

“If we do nothing, Waze will lead us on a race to the bottom – where traffic plans are ignored and every street is gridlocked,” said Ryu.

The councilman says he’s proposing the lawsuit because Waze has “repeatedly failed to fix significant safety concerns” he has raised.

An email seeking comment from Waze was not immediately returned.   Read article.

Ryu claims one narrow street in his Sherman Oaks district sometimes sees more than 675 vehicles an hour because of drivers using the Google-owned app. He says the increased traffic is causing accidents and damaging roads not meant for heavy traffic.  Read article

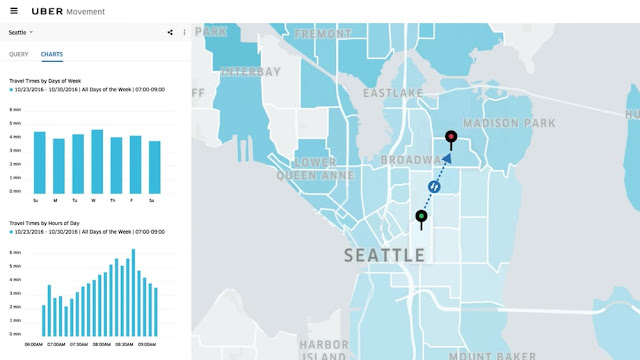
Uber Launches Historic Traffic Map

Uber Launches Historic Traffic Map

Uber is opening up in an area where it might make sense competitively for it to stay more closed off: The ride-hailing company’s new Movement website will offer up access to its data around traffic flow in scores where it operates, intended for use by city planners and researchers looking into ways to improve urban mobility. The basic idea is that Uber has a lot of insight into how traffic works within a city, and it can anonymize this data so that it isn’t tied to specific individuals in most cases. So where that’s possible, Uber is going to begin sharing said data, first to specific organizations who apply for early access, and then eventually to the general public. Uber says it was looking at all the data it gathered and began to realize that it could be used for public benefit, and assembled a product team to make this happen. The result of this effort was Movement, which aims to address problems city officials and urban planners encounter when they’re forced to make key, transformational infrastructure decisions without access to all of, or the proper information about actual conditions and causes. Essentially, according to Uber, it’s hoping to make it easier for those with influence over a city’s transportation picture to make the right decision, and to be able to explain why, where and when the changes are happening with accurate data backing them up. It also wants to do this in a way that makes it easy for organizations to work with, so it’s releasing the data organized around traffic analysis zones within cities, which are agreed-upon geographic demarcations that help with existing urban planning and traffic management.

Uber releasing this kind of data publicly is going to raise some eyebrows from privacy advocates, but the company stresses that it’s ensuring user privacy by only offering up data where it can be successfully aggregated and anonymized. For parts of a city where it determines there isn’t enough data to properly protect driver and passenger identities, it simply won’t return results for queries, Uber says. Another question is why Uber would bother at all, given that its ability to accurately map traffic demand is part of the reason its able to do demand prediction well at all, which is a core competitive advantage for it in the ride-sharing business. Uber says it wants to do some good in the cities where it operates, for one, but it also stands to benefit from infrastructure improvements in cities.  Maybe Uber would be open to taking Bad Intersections data as well? 


Most Dangerous Intersections in California

Most dangerous intersections in Southern California

A new study shows the most dangerous intersections in California that have 10 or more accidents, injuries, or fatalities.  based on motor vehicle collision data from 2015. There were 444 total intersections ranked from the 435,000 compiled collision records, according to the data by Statewide Integrated Traffic Records System (SWITRS).

In total, there were 7,294 crashes, 7,478 injuries, and 57 fatalities. The average number of accidents per dangerous intersection was 16.43 and for injuries, it was 16.84. The City of Sacramento had the second-highest total number of dangerous intersections (13) trailing only Los Angeles (221), which is a noticeable difference.  Estey & Bomberger created the map and correlated the data.

We took the intersections and added them to our map of over 9,000 locations Nationwide.  Do a search for "California" and you will find these ranked locations.

Bus Stops & Dangerous Pedestrian Intersections

blue and white bus stop sign
Bus Stops & Dangerous Pedestrian Intersections

It is no surprise that bus stops and dangerous pedestrian intersections are highly correlated. Dangerous Intersections have found while we have mapped over 8,000+ dangerous intersections in the last year that pedestrians are very vulnerable at these locations.  Drivers need to be more aware of bus stop locations for pedestrians to cross the street.  We are looking to get these dangerous intersections near bus stops on our map.  

Bus stops located near dangerous pedestrian intersections can pose a safety concern for pedestrians, particularly when crossing busy roads to access or leave the bus stop. Here are some considerations regarding bus stops and dangerous pedestrian intersections:

Visibility: The visibility of pedestrians and drivers at bus stops is crucial for safety. Bus stops should be located in areas with good visibility, allowing drivers to see pedestrians waiting or crossing the road and enabling pedestrians to observe oncoming traffic.

Traffic Calming Measures: Implementing traffic calming measures near bus stops and dangerous pedestrian intersections can help reduce vehicle speeds, improve pedestrian safety, and provide a safer environment for bus users. These measures may include speed humps, raised crosswalks, or traffic islands.

Signalized Crosswalks: Installing signalized crosswalks or pedestrian-activated traffic signals near bus stops can enhance safety by providing dedicated crossing times for pedestrians, allowing them to cross the road safely.

Sidewalks and Pedestrian Infrastructure: The presence of sidewalks, footpaths, and proper pedestrian infrastructure near bus stops is essential. This allows pedestrians to access the bus stop without having to walk on the road or through hazardous areas.

Adequate Lighting: Proper lighting around bus stops and at dangerous pedestrian intersections enhances visibility and improves safety, particularly during low-light conditions or at night.

Clear Signage and Markings: Clearly marked crosswalks, signage indicating the presence of a bus stop, and visible markings can help guide pedestrians and drivers, promoting safer interactions at bus stops and nearby intersections.

Public Awareness and Education: Educating both pedestrians and drivers about bus stop safety and the need to exercise caution at dangerous pedestrian intersections can help raise awareness and reduce the risk of accidents.

Local transportation authorities, municipalities, and transit agencies are responsible for evaluating and addressing safety concerns at bus stops and dangerous pedestrian intersections. They conduct assessments, implement safety measures, and monitor the effectiveness of interventions to ensure pedestrian safety.


Fatal Car Accidents at Intersections in Florida Heatmap

Heat Map of Fatal Accidents in Florida Reported by FARS
Florida Fatal Car Accidents Heatmap

Every year Florida leads the Nation with the most fatal car accidents at intersections.  Why is this?  Is it because of the older people driving and shouldn't be?  I would be curious if any studies have been done to analyze this fact.  Please post study links in the comments section.  This data was pulled from the FARS (Fatal Accident Reporting System).  

Fatal Car Accidents at Intersections Heatmap Reported to FARS

USA Heat Map of Fatal Car Accidents Reported by the Federal Accidents Reporting System (FARS)
Fatal Car Accidents at Intersections Heatmap Reported to Federal Accidents Reporting System (FARS) from 2010-2015

Google Maps Show Obvious Dangerous Pedestrian Intersection

dangerous intersection
Wilson & Veitch & Claredon in Arlington, Virginia Dangerous Pedestrian Intersection
The Red Car Pictured Above Is Going The Wrong Direction 

We couldn't find any data to support this claim. However, someone that lives in the area tipped us off about this notoriously dangerous pedestrian intersection in ‪Arlington‬, Virginia‬ shows a red car going the wrong way on ‪Google Maps‬.

Dangerous Train Intersections

Dangerous Train Intersections According to the Federal Railroad Administration
Search the map for #FRA

Train and car accidents can vary widely depending on various factors such as location, traffic conditions, railway infrastructure, and driver behavior. The number of train and car accidents can also vary from year to year.

To obtain the most accurate and up-to-date information on train and car accidents, I recommend referring to reliable sources such as transportation safety agencies, railway authorities, or governmental organizations responsible for collecting and reporting accident data. These organizations often publish annual reports or maintain databases with statistics on train and car accidents.

For train accidents specifically, the Federal Railroad Administration (FRA) in the United States collects and reports data on railroad safety, including train accidents. Their website provides comprehensive information on train accidents and other safety-related data.

For car accidents, the National Highway Traffic Safety Administration (NHTSA) in the United States is a valuable resource. They collect and report data on motor vehicle crashes, including car accidents, providing detailed statistics and analysis on various aspects of road safety.

Dangerous Intersections

Map of United States Dangerous Intersections
Heat Map of Dangerous Intersections in the USA

Dangerous Redondo Beach Pedestrian PCH Intersection

PCH and Vincent Intersection Street View
PCH and Vincent Needs A Crosswalk Upgrade

Pacific Coast Highway and Vincent Street in Redondo Beach is apparently a problem according to this fatal accident back in 2014.  Redondo Beach Union High School is across the street and can imagine there is a lot of student and kids crossing the street on a daily basis.  I almost experienced an issue last night.  I could hardly see an older woman crossing the street.   See our Dangerous Intersections map of other problematic intersections in the area.